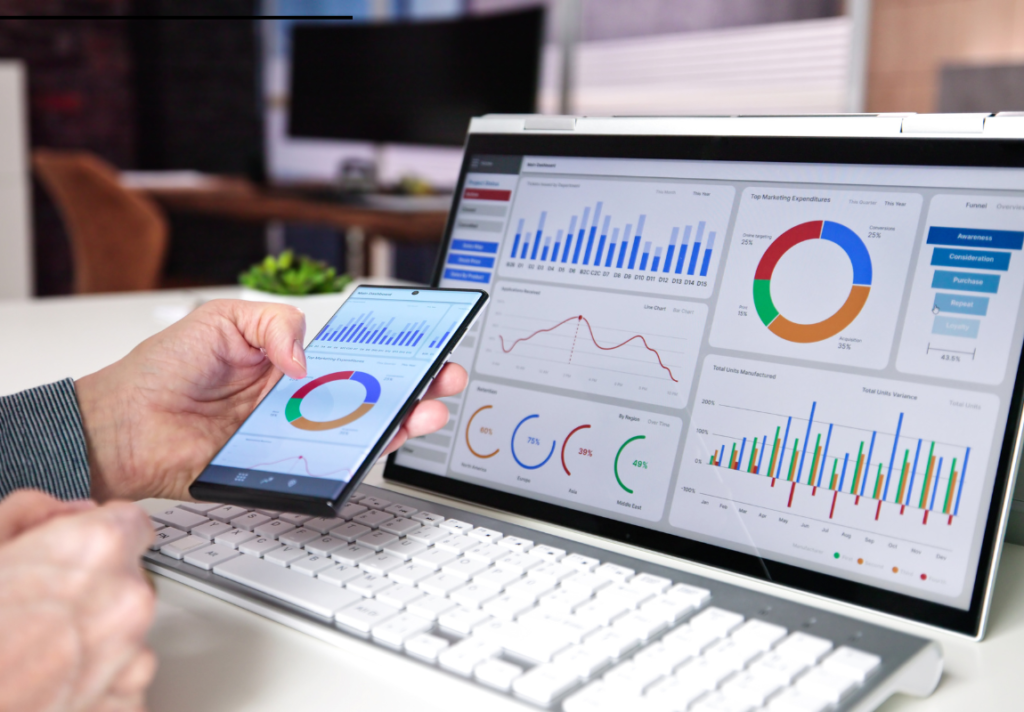
Why Data Visualization Should Be a Part of CPG Key Strategy

In today’s fast-paced, data-driven world, consumer packaged goods (CPG) companies face an ever-growing need to leverage data effectively to stay competitive. With the explosion of data from various sources, including sales, marketing, supply chain, and customer feedback, the challenge lies in making sense of this vast amount of information. This is where data visualization comes into play. Data visualization transforms complex data sets into intuitive and interactive visual representations, making it easier for decision-makers to grasp insights quickly and take action. Here are compelling reasons why data visualization should be a cornerstone of any CPG key strategy.
1. Enhancing Decision-Making with Clarity and Speed
Data visualization tools allow CPG companies to convert raw data into visual formats such as graphs, charts, and maps. These visualizations help in identifying patterns, trends, and anomalies that might not be apparent in traditional spreadsheets. For example, sales trends over different regions can be more effectively compared using heat maps, allowing executives to quickly pinpoint areas that need attention or are performing exceptionally well. This clarity accelerates the decision-making process, enabling timely and informed choices that can significantly impact the bottom line.
2. Simplifying Complex Data for Better Communication
CPG companies often deal with multifaceted data sets involving numerous variables, such as market dynamics, consumer behavior, and supply chain logistics. Data visualization simplifies this complexity by distilling data into easily understandable visuals. This not only aids internal stakeholders in grasping critical insights but also enhances communication with external partners. When presenting to stakeholders, investors, or board members, clear and compelling visuals can effectively convey the story behind the data, fostering better understanding and alignment on strategic initiatives.

3. Driving Innovation through Deeper Insights
Innovation is a key driver in the CPG industry, with companies constantly seeking ways to improve products, optimize processes, and enhance customer experiences. Data visualization enables deeper insights by uncovering hidden patterns and relationships within the data. For instance, visual analytics can reveal correlations between customer demographics and purchasing behavior, helping CPG companies tailor their marketing strategies and product offerings to meet specific consumer needs. By leveraging these insights, companies can innovate more effectively and stay ahead of market trends.
4. Enhancing Operational Efficiency
Operational efficiency is crucial for CPG companies aiming to maximize profitability while maintaining high standards of quality and service. Data visualization tools can help optimize various aspects of operations, from supply chain management to inventory control. For example, visualizing supply chain data can identify bottlenecks and inefficiencies, allowing companies to streamline processes and reduce costs. Similarly, inventory management dashboards can provide real-time visibility into stock levels, helping prevent overstocking or stockouts and ensuring a smoother flow of goods.
5. Facilitating Proactive Risk Management
In the dynamic CPG industry, risk management is essential to mitigate potential disruptions and maintain business continuity. Data visualization plays a critical role in identifying and assessing risks by providing a clear view of risk factors and their potential impact. For instance, visualizing supply chain data can highlight vulnerabilities related to suppliers, logistics, or geopolitical factors. By proactively identifying these risks, CPG companies can develop contingency plans and take preventive measures to minimize adverse effects.
6. Enabling Personalized Customer Experiences
Understanding and meeting customer expectations is a top priority for CPG companies. Data visualization helps in creating personalized customer experiences by analyzing customer data and preferences. By visualizing customer journey maps, purchase history, and feedback, companies can gain valuable insights into customer behavior and preferences. This enables the development of targeted marketing campaigns, personalized product recommendations, and improved customer service, ultimately enhancing customer satisfaction and loyalty.
7. Supporting Data-Driven Culture
Fostering a data-driven culture is essential for CPG companies aiming to harness the full potential of their data assets. Data visualization tools democratize data access, making it easier for employees at all levels to interact with and understand data. When employees can visualize data relevant to their roles, they are more likely to make data-driven decisions and contribute to the company’s strategic goals. This cultural shift towards data-driven decision-making can lead to improved performance, innovation, and competitive advantage.
8. Improving Competitive Intelligence
Staying ahead of the competition requires continuous monitoring and analysis of market trends, competitor activities, and consumer preferences. Data visualization enhances competitive intelligence by providing a comprehensive view of the competitive landscape. By visualizing market share, sales performance, and competitor strategies, CPG companies can identify opportunities and threats more effectively. This intelligence enables companies to adjust their strategies proactively, capitalize on emerging trends, and maintain a competitive edge.
9. Maximizing ROI on Data Investments
Investing in data infrastructure, analytics tools, and talent is a significant commitment for CPG companies. To maximize the return on these investments, it is crucial to extract actionable insights from the data. Data visualization helps in this endeavor by transforming data into valuable information that drives strategic decisions and operational improvements. By leveraging visual analytics, CPG companies can ensure that their data investments yield substantial returns in terms of enhanced performance, efficiency, and profitability.
10. Facilitating Compliance and Reporting
Compliance with regulatory requirements and accurate reporting are critical aspects of the CPG industry. Data visualization tools can simplify compliance and reporting processes by automating data collection and analysis, and presenting the results in clear, easily interpretable formats. This not only reduces the risk of errors but also saves time and resources. Visual dashboards can provide real-time updates on compliance metrics, making it easier for companies to stay compliant and address any issues promptly.

Conclusion
In conclusion, data visualization is an indispensable component of a CPG key strategy. By transforming complex data into intuitive visual formats, it enhances decision-making, simplifies communication, drives innovation, and improves operational efficiency. It also facilitates proactive risk management, enables personalized customer experiences, supports a data-driven culture, and enhances competitive intelligence. Moreover, data visualization maximizes ROI on data investments and streamlines compliance and reporting processes. As CPG companies continue to navigate an increasingly data-rich environment, the adoption of data visualization will be crucial for achieving sustained success and maintaining a competitive edge.
Have A Question?
Learn how Analyticsmart can elevate your retail performance with data-driven insights and customized solutions.
Contact Sales
Have a question or comment? Submit your message through our contact form and a member of our team will get back to you within 24 hours.
Marketing Head | Analyticsmart
Unlock Your Retail Potential With Us
